Airbnb (ABNB) AirbnB is set to report earnings for the […]
Airbnb: Meme Stock or the Real Deal?
October 21, 2022
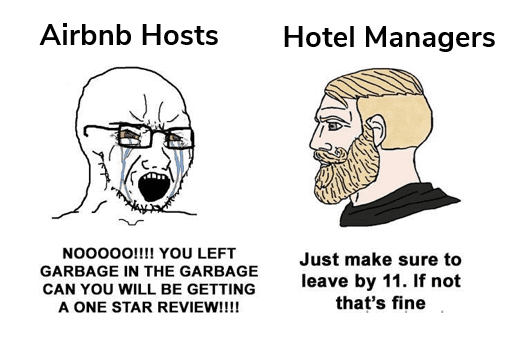
| By now you’ve probably seen memes like this going around, highlighting a major consumer pain point for Airbnb and a selling point for traditional hotels. |
| Even our data confirms that consumer mentions of Airbnb fees and cleaning requirements are rising… +150% YoY to be exact. My goodness – that can’t be a good thing, can it? Well – let’s cut through the noise. In this instance, many of the (albeit funniest) meme’ers aren’t ABNB consumers anyway. That’s why it’s important to consider actual customers vs. overall chatter.Here’s how we approach data analysis for Airbnb. 1. Monitor Consumer Sentiment Levels Consumer Sentiment is probably the best long-term indicator for future company growth in the LikeFolio universe. We measure consumer sentiment by calculating the percentage of positive consumer mentions out of all consumer mentions that contain a sentiment indicator…or: Positive Sentiment/(Positive Sentiment + Negative Sentiment) This ensures that volume changes across the board (in regard to brand popularity) don’t impact analysis. Essentially, regardless of how sample size changes, our ratio should remain consistent and allow for us to compare change in sentiment over time. For ABNB, despite the rise in consumer frustrations related to cleaning fees, the overall ratio hasn’t shifted that much. Airbnb happiness levels have dropped by 1 point over the last year but remain 7 points higher vs. 2020 lows. |
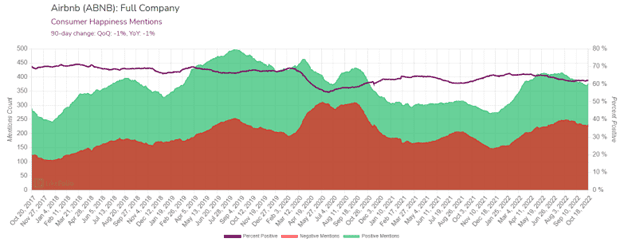
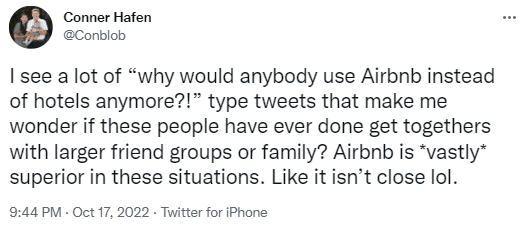
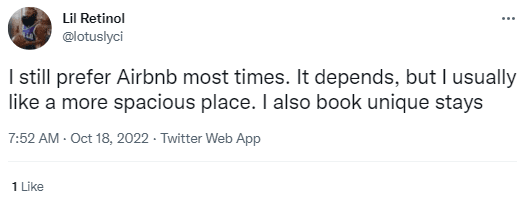
| This tells us that for every added negative sentiment tweet, there’s generally an added positive sentiment tweet to offset it. Tweets like these: |
| Key Takeaway: Overall Consumer Sentiment hasn’t shifted in a negative way for Airbnb yet, despite what memes may portray. 2. Spot Shifts in Consumer Demand Consumer demand in Airbnb’s case is comprised of mentions from consumers who booked an Airbnb stay. These mentions peaked during a hot summer travel season but do remain considerably elevated YoY: +27%. |
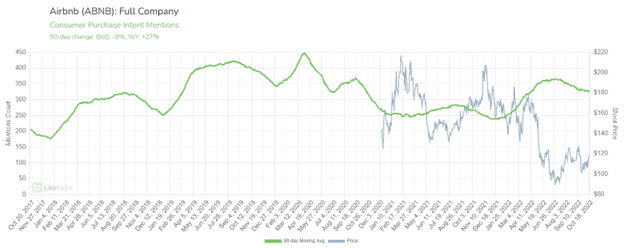
| In fact, this growth rate is accelerating in the first few weeks of 22Q4, beginning in October. Demand so far is pacing +34% YoY…higher vs. the 90-day Moving Average. This is a nice indicator of momentum. 3. Isolate the Metrics that Matter Back testing is an essential part of company analysis. We test every metric and data source to understand how these metrics correlate to revenue. A new metric in the LikeFolio universe caught our attention, due to the positive correlation to revenue: |
- Airbnb Mobile App World Monthly Downloads: .69 correlation to revenue
| World mobile app monthly downloads (across Google and Apple stores) show that downloads increased by +24% from July-September 2022 vs. the same period the prior year. |
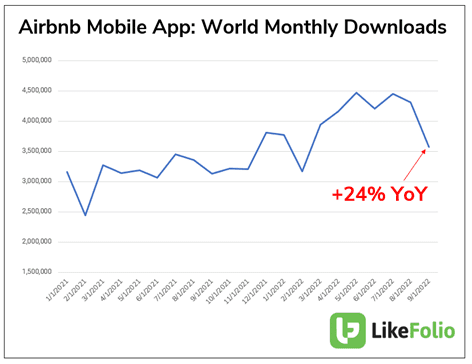
| Considering the correlation to revenue, this means that based on this metric, we expect revenue to continue to grow. This metric improvement could be propelled by consumer macro tailwinds…namely, international travel mentions on social media, up +64% YoY. |
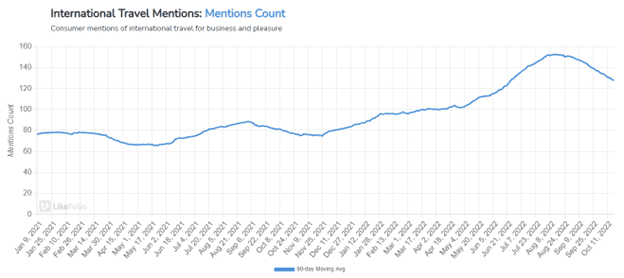
Global app usage is a critical lens to consider when analyzing Airbnb, especially if we are blinded by U.S.-only habits.
On its earnings call, Airbnb hinted that the pendulum was beginning to swing back the other way…in favor of international and urban travel vs. rural destinations frequented during the pandemic.
“It's good to remember that before the pandemic, our bread and butter was cross-border and urban. Right? That was our bread and butter, it was cross-border travel and urban travel.
And of course, when the pandemic occurred, that got primarily shut off and yet our business recovered because people were using it differently. I think that really the key important thing here is that our model is obviously incredibly adaptable. We are in nearly every community in the world. We have nearly every type of space and nearly every type of price point.
And I think that's the reason that Airbnb people would use Airbnb will continue to endure. People are looking for value. They want to feel like they live at the local. As more and more people have flexibility and trip length and continues to increase, nearly half of our business is a week or longer as prohibitive probably to stay in hotels.
So there's a lot of new use cases that we think are here to stay. So the thing I'm pretty excited about is that a lot of the older use cases cross-border and urban are coming back.”
So perhaps the comparison of hotels vs. Airbnb is really a case of comparing apples to oranges…different use cases, different priorities.
Bottom line: Airbnb metrics are improving, though technically still within the neutral category from an Earnings perspective. But strength on the international front seems likely.
We’ll be closely monitoring all of the metrics in this report for changes ahead of the company’s next earnings release on November 1.