Follow these steps: Go here: https://dashboard.likefolio.com/users/password/new Put in your email address. […]
The Research Page
The research page of the LikeFolio Research Dashboard is a powerful view into the social data behind a company's brands and products.

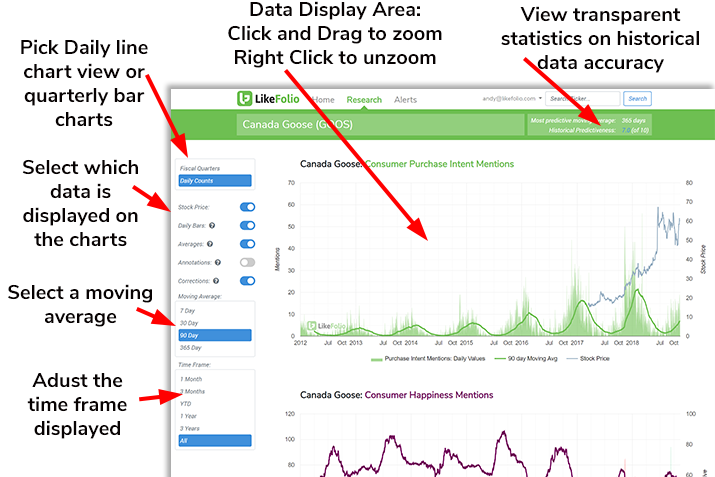
Charts Display
This is the heart and soul of LikeFolio data. On the research page you will find:
Consumer Purchase Intent Mentions -- spot trends and shifts in actual consumer spending behavior on Main Street, before it becomes news on wall Street.
Consumer Happiness Mentions -- How happy are consumers when they deal with this company? How has that changed over time? Is a current crisis unfolding -- how bad is it?
Consumer Overall Mentions (Buzz) -- How much are people talking about the products this company makes? Excellent to watch during new product announcements or to measure the severity of happiness drops during boycotts or other crisis events.
Note that you can click on items in the charts to get a numeric value or more information. You can also click & drag to zoom in on a specific area (right click to unzoom)
Display Controls (Left Column)
Here you can adjust what is being displayed in the charts area.
Fiscal Quarters vs. Daily Counts -- adjusts the display from a line chart (daily counts) to a bar chart (fiscal quarters). Generally speaking, Daily Counts is a good view for spotting trends and shifts while fiscal quarters is a good view for analyzing purchase intent into earnings reports.
Stock Price On/Off -- you can choose to have the stock price displayed on the chart or not. Good for seeing patterns and correlation, but some like it off to avoid distraction.
Daily Bars On/Off -- Daily bars can sometimes have huge spikes that distort the
Averages On/Off -- On will display the moving average selected in the control section below. Off will remove moving averages from the chart.
Annotations -- When on, we will display annotations on daily bars where large events occurred such as boycott announcements, new product rollouts, etc. Use to spot specific events or understand the reasons behind large mention spikes.
Corrections On/Off -- When on, LikeFolio will eliminate some large mention spikes of questionable relevance to give the data a smoother, more realistic view.
Moving Average Select -- Choose the moving average that is most applicable to your research. The shorter the moving average, the more impactful each daily event will be in the trend. The longer the moving average, the more of a long-term trend will be on display. The 90 day moving average is the default. Some clients like to go shorter for event detection while others prefer a full year moving average, especially on highly seasonal businesses.
Time Frame -- Choose the starting time frame to view in terms of how long into the past you want to view. The maximum view is Jan 1, 2012 - present. You can also zoom in on specific areas of the chart by clicking and dragging (right click to unzoom)
Historical Predictiveness
This area at the top right of the research page is intended to provide members with maximum transparency into the best approach for using LikeFolio data for that particular company.
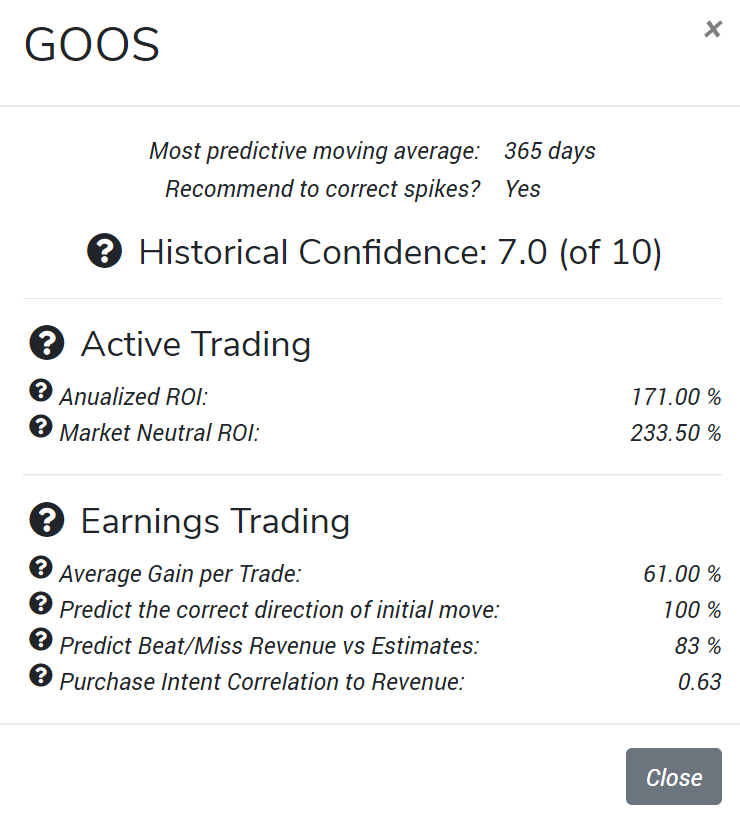
When you click on the historical confidence number, you'll see the following information in the pop-up.

This data is designed to give you clues as to the best way to use the research dashboard as well as transparency into how effectively our data has been predictive for that stock.
Some companies are more predictive on a 90 day moving average with corrections on, and others are more predictive on a 365 day moving average with corrections off.
Our historical trading system statistics come from strategies implemented in the LikeFolio White Paper, and are designed to give our members insights into how much confidence they should have that the data they are viewing can be used to influence trading decisions.
